
- Markets reacted strongly to what was possibly a fluke in the data in February. The sharp rise in volatility exaggerated the true significance of the sell-off.
- As the dust settles it becomes ever clearer that the “correction” was none at all. Even at its most extreme it was in line with traditional annual drawdowns.
- Yet, anyone betting on an extended expansion will ultimately worry about rising price pressures and a rear-guard fight by the Fed to raise rates. But the bigger worry is a rise in long term rates, which are under assault by the Trump administration’s fiscal expansion and the Fed’s balance sheet reduction.
- In addition, asset prices have become more stretched, investor confidence has continued to wane and volatility is on the rise, making it more expensive for investors to insure against down-moves in the stock market. In this context, a strong economy offers only scant comfort.
- This could be the year when investors will start interpreting good news for the economy as bad news for the market.
What happened, what does it mean and where will it end? Such are the questions that face investors who have witnessed a spectacular 320% rally in the S&P500 since it reached its nadir in March 2009. The index delivered close to 20% last year alone and rose another 5% during January 2018. The latest leg of the rally started once markets had digested the shock of China’s exchange rate adjustment by February 2016 and it accelerated further once the outlines of the Trump tax cuts became clear. It then came to an abrupt halt on February 2nd, when the S&P500 went into sharp reverse and declined as much as 10% over the following week (before rebounding and ending the week just 5.1% down). Over the course of the week, the sell-off engulfed worldwide stock markets, dragging down Japan 5.3%, the UK and the Eurozone 7.1% and emerging markets also 7.1% (led by China’s 10% loss). Most notably, volatility, as measured by the VIX, spiked from single digits to 50%, before settling in the 20-30% range. Other markets, such as US and European credit, suffered some collateral damage but did not witness a dramatic sell-off.
Yields, Wages & VIX
Perhaps more surprising than the sell-off was the market’s unabated rise throughout a period of increasing long-term yields (see chart), during which US 10yr yields rose by over 60 bps from a low of 2.04% in September 2017. Once they reached the technical resistance level of 2.66%, the market suddenly turned. This moment coincided with the release of a higher-than-expected January wage growth figure in the US (2.9% yoy) as part of the monthly non-farm payroll report. As the sell-off deepened, yields rose further and volatility spiked. This, in turn, prompted the implosion of so-called inverse-volatility products (which bet on volatility remaining low), adding further fuel to fire. 
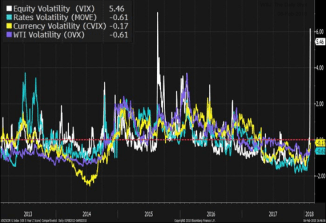
The argument has been made that the VIX has lost some of its usefulness as a volatility gauge as it has become a traded product itself. But this is true for other financial indicators too, which are nevertheless referenced, and in any case, the pick-up in daily variance can be observed directly in price swings. However, it is worth noting that volatility did not initially spread to other markets and their related metrics such as the MOVE (rates), the CVIX (currencies) or the OVX (WTI crude). The episode provides some illustration as to how the so-called ‘volatility paradox’ can play out: a long period of low volatility, especially when coupled with extremely low interest rates, can generate a false sense of calmness which leads to a build-up of leverage in areas outside of investors’ natural habitat, which can then result in sharp adjustments when triggered by seemingly random shocks.
While the risks are clear, the outlook from here is far less so:
- Some investors are sanguine in the face of the expected extension of the current expansion (now in its 9th year) and regard the recent market decline as a buying opportunity. Indeed, the NY Fed’s model puts the probability of a recession in the next 12 months at just over 10%.
- Others worry that the economy has reached full employment and that any stimulus in the form of tax cuts may thus fuel inflation. I attribute a lower probability to such as scenario as there are good structural reasons for wage growth to remain contained. What is more, the latest rise in wage growth can easily be attributed to the severe weather during the month as a map of areas of unexpectedly cold weather correlates well with regional discrepancies in price rises for apparel (up) and entertainment expenses (down). The alternative Atlanta Fed wage series and the decline in hours worked during the month (again, due weather conditions) suggest much the same.
- Still others (including me) see the greatest risk both to and from long-term rates. On the one hand, this reflects the effect of the Fed’s balance sheet reduction, which will boost the annual net Treasury supply to the market by some 60-70%. On the other hand, it reflects the unfunded nature of the administration’s fiscal expansion, aggravated by the recent spending deal approved in Congress (worth another $300 bn over two years) as well as the potential for stepped up infrastructure spending.
Where Does This Leave Us?
After six consecutive up trading days, the S&P500 is now only slightly below its end-2017 level (3%) and once more above its “trend channel”. This means that the early February “correction” has mostly been undone and momentum was never seriously disrupted. Even at its more extreme, the “correction” merely took back some of the excesses that followed the announcement of the tax reform. This is problematic for several reasons:
- Historically not significant: The spike in volatility that accompanied the temporary sell-off exaggerates the historical significance of the move. The aberration was the lack of any such adjustment during 2017, rather than the adjustment in 2018, which was bang in line with the long-run average of maximum annual drawdowns.

- Bubble then, bubble now: If the stock market was in bubble at the end of January and levels have barely budged since then all told, then it remains in a bubble now. Indeed, Prof. Robert Shiller has pointed out that if people believe that something is overpriced but nevertheless buy it in the hope that its price will rise further, this meets the classic definition of a bubble (James Montier has recently expounded on the different types of bubbles here). Both recent Merrill Lynch surveys and the Yale Confidence Indices confirm that this is the case.

- Valuations little changed: At its worst, the combination of the sell-off and a rise in earnings expectations had led to a fall in forward P/Es from 20.1 to 17.1. This took the ratio back two years, to levels seen in 2016. However, on the basis of actual P/Es, the ratio merely declined from a peak of 23.3 to 21.5, a level reached a few months ago. When looked at in terms of book value (which is less affected by the prospect of tax reform), the adjustment is even smaller. And in comparison to bonds, the yield-to-dividend differential hadn’t reached the current 100bps since the 2013 taper tantrum, implying that the stock market doesn’t look attractive at all. Furthermore real yields may have adjusted significantly from recent levels, but at 0.80% they would need to go up much further if financial conditions are to tighten significantly, again suggesting that equities look unattractive.

The Bottom Line
It remains true that the economy appears in good health and that earnings expectations are rising. Indeed, the ISM manufacturing survey is at levels last seen 1½ decades ago and the Michigan consumer survey has to reach back to the early years of the millennium for similar levels. Yet, the broader paradigm is changing. Anyone betting on an extended expansion will ultimately worry about rising price pressures and a rear-guard fight by the Fed to raise rates. But the bigger worry is a rise in long term rates, which are under assault both by the Trump administration’s fiscal expansion and the Fed’s balance sheet reduction. In addition, compared to last year, asset prices are even more stretched, investor confidence has continued to wane and volatility is on the rise, making it more expensive for investors to insure against down-moves in the stock market. In this environment, a strong economy offers only scant comfort.
At some point, investors will thus stop interpreting good news for the economy as good news for the market (due to higher earnings) and instead view them as bad news (due to higher inflation and/or rates). This could be the year when that happens.
